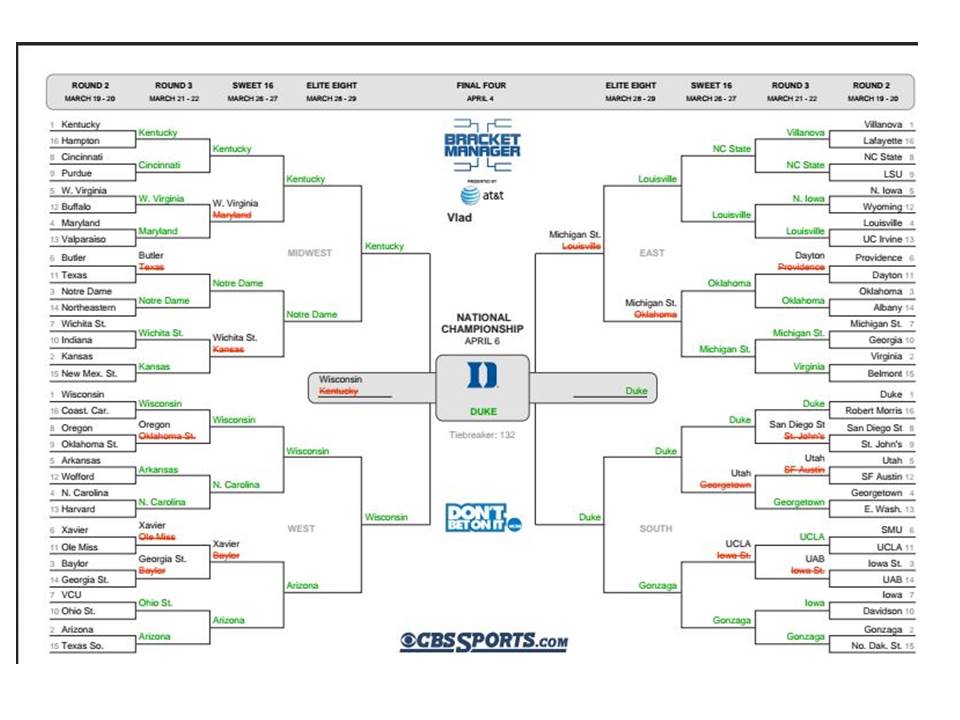
Every year during March Madness Men’s Basketball Tournament thousands of people fill out their brackets. Most of these brackets are filled out with gut based decision making or a bias towards your favorite team or alma mater. But what if there is a way to put data science to use and win your pool? This is the answer I set out to seek, and I can tell you that I not only predicted Duke to win it all but also guessed 47 of 63 games right, with an accuracy of 74.6%. My actual bracket is below, click to enlarge.
 Building the Data Model
Data Modeling the NCAA tournament isn’t the easiest thing to do as there are many data sources and you don’t know exactly which variables will help you derive the right model. This is why I started to look at 2014 tournament data to understand what variables can be gathered to help me make a descriptive model to predict the 2015 tournament.
I downloaded the 2014 data with the following variables: Wins, Losses, Winning Percentage, RPI, Strength of Schedule, AP ranking, Coaches Poll Ranking, Tournament Seed, Points Per Game, and Points Allowed. All of these variables are descriptive variables and not the dependent variable or goal of the data model.
The goal of the data model is to predict the winner of each game based on the descriptive variables. In order to do this, I created a goal variable called Tournament Wins. The maximum wins that a team in 2014 could have had is 5, which was University of Connecticut. I manually counted the number of wins for all 64 teams in the 2014 tournament and added the goal variable to my spreadsheet.
Processing the Data Through a Data Mining Tool
To process the descriptive variables and how they relate to the dependent variable Tournament Wins, I used a free machine learning tool called Weka. This allowed me to use different mining algorithms to process the data and create a descriptive model. First model I ran was a Conjunctive Rule model, which told me that Strength of Schedule had a 73% correlation with Tournament Wins.
Second, Decision Tree model told me that Strength of Schedule had a 74% correlation coefficient with Tournament Wins. Third, Linear Regression model told me that it was Winning Percentage and Strength of Schedule that had the highest impact on Tournament Wins with 64% correlation coefficient. It also showed that Points Per Game had a negative correlation with Tournament Wins. Last, the M5 rule model told me that winning percentage, and strength of schedule had an 82% correlation coefficient with Tournament Wins.
Descriptive Model Conclusion
From the data models, I concluded that Tournament Wins were very much influenced by the Strength of Schedule and Winning Percentage of the team. I started to fill out my bracket focusing on both of these rules and realized that sometimes one team had the stronger strength of schedule while the other team had the winning percentage. I needed a tie breaker for the tournament. I knew that Points Per Game was negatively correlating Tournament Wins, I decided to use the team that allows the fewest points as the tie breaker. Thus, it was Strength of Schedule, Winning Percentage and if needed the team with the lowest points per game allowed. Based on these rules I filled out the tournament bracket above and was able to get 74.6% of the games right, predicted the winner to be Duke, and won my pool.