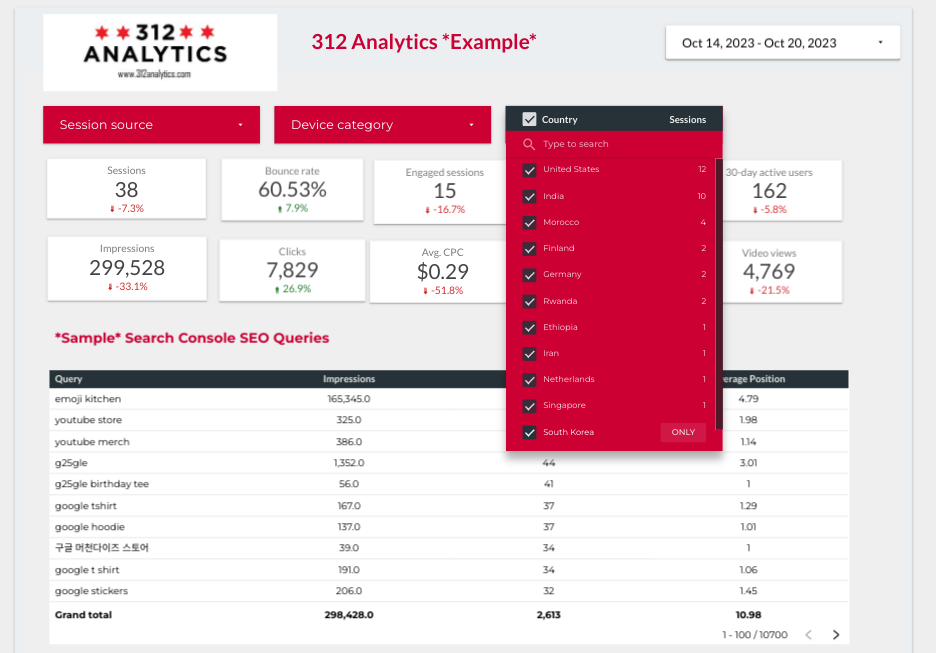
Make them interactive; they will use them
Quality data collection is the key starting point of the Dashboard journey. For this, you need a GA4 Audit or a KPIs plan. Starting out with bad data isn’t going to make the best dashboard design valuable. This needs to be planned out and discussed in how you want to collect your site’s events properly.
When you are building a dashboard, consider your audience. If you’re sharing data with the executive level you need KPIs. If your dashboard is being used by Management and Individual contributor-level staff, then you need an OPI dashboard or Operational Performance Indicators. Each of these deserves its own cut of the same data.
Keep in mind that your Executives need to see KPIs and potential trends. Management and Individual Contributors need to see everything to improve KPIs. Operational Performance Indicators need to roll up to your KPIs.
OPIs are the leading indicators when things are improving or changing. Most importantly, your employees may leave your organization but a great dashboard can be used and improved for years. This is why a partner that knows how to put data in front of your team in a useful format is valuable.
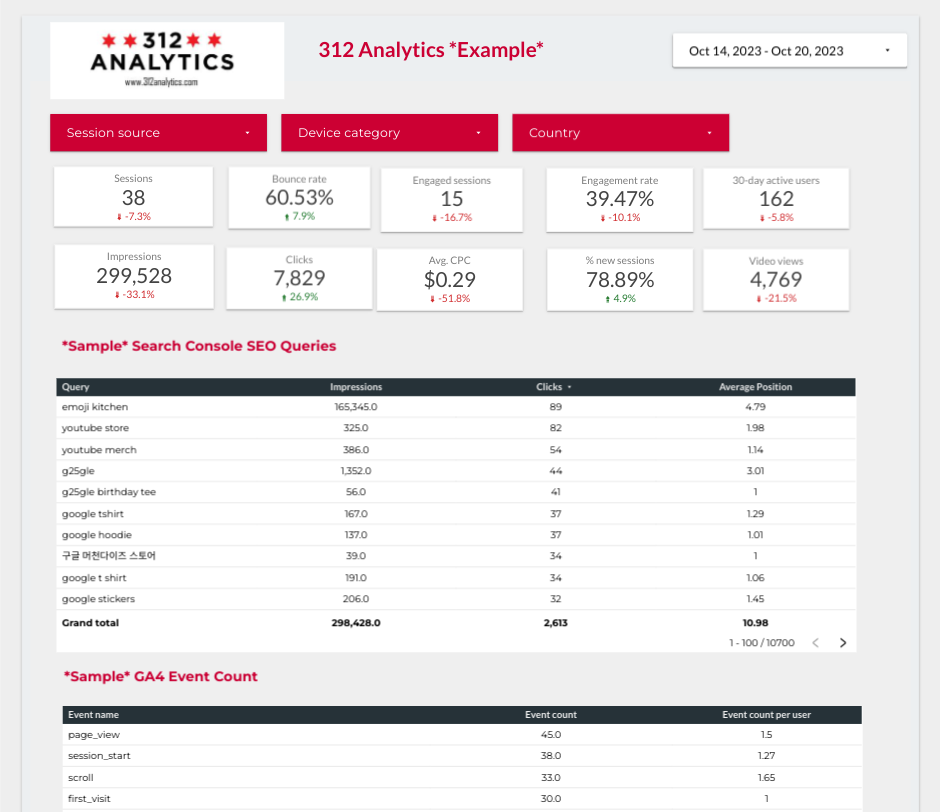
Operational Performance Indicator dashboard examples:
- Custom GA4 Events
- Custom Dimensions
- Filters with a Purpose
- Classify Audiences
- Acquisition Channels
- Drill Down to Lower Granularity
- Drill up for Context
- Advertising
- Paid Search
- Focus on OPIs and KPIs
- Answer Business Questions
- Provide Summary Metrics